All elements of this simulation are licensed under Licence Creative Commons Attribution 4.0 International License.
Long room with specular reflection and uniform absorption
What is tested?
Comparison between SPPS/TCR simulations and results from the NORMAL code described in [Yang, 2000].
[yang, 2000] L.N. YANG, B.M. SHIELD, DEVELOPMENT OF A RAY TRACING COMPUTER MODEL FOR THE PREDICTION OF THE SOUND FIELD IN LONG ENCLOSURES, Journal of Sound and Vibration, Volume 229, Issue 1, 2000, Pages 133-146, ISSN 0022-460X, dx.doi.org/10.1006/jsvi.1999.2477.
Description
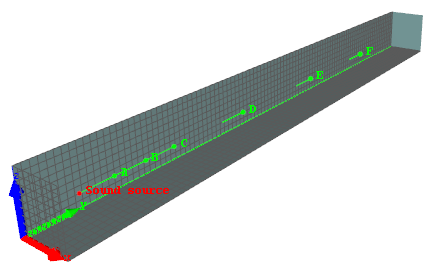
Academic case: Long room (8m x 100m x 9m) with specular reflection (no diffusion) and 10% uniform surface absorption, with a single source and 6 punctual receivers.
Reference
Reference

All elements of this simulation are licensed under a Creative Commons Attribution 4.0 International License.
Reference
Description
Academic case: Long room (8m x 100m x 9m) with specular reflection (no diffusion) and 10% uniform surface absorption, with a single source and 6 punctual receivers.

What is tested?
Comparison between SPPS/TCR simulations and results from the NORMAL code described in [Yang, 2000].
[Yang, 2000] L.N. Yang, B.M. Shield, Development of ray tracing computer model for the prediction of the sound field in long enclosures, Journal of Sound and Vibration, Volume 229, Issue 1, 2000, Pages 133-146, ISSN 0022-460X, dx.doi.org/10.1006/jsvi.1999.2477.
Reference
CAUTION - The following results present comparisons between numerical simulations carried out with I-Simpa and 'reference' data available in the scientific literature.
- It is difficult to prejudge the concept of 'reference'. The deviation between the simulations and the reference data that can be observed do not necessarily call into question the corresponding simulations but can also be associated with other sources of deviation (modeling assumptions, numerical instabilities, experimental uncertainties, etc.).
- Note also that these comparaisons can also show the limitations of some numerical codes.
Results
Sound pressure level (SPL)
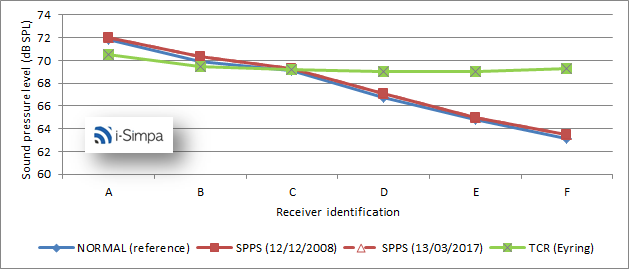
This figure shows a very good agreement between the SPPS code results and the reference data, for the sound pressure level. In addition, and as expected, one can observe the decrease of the sound level in the corridor, which can not be predicted using the classical theory of reverberation (as calculated with the TCR code).
Reverberation time (RT30)
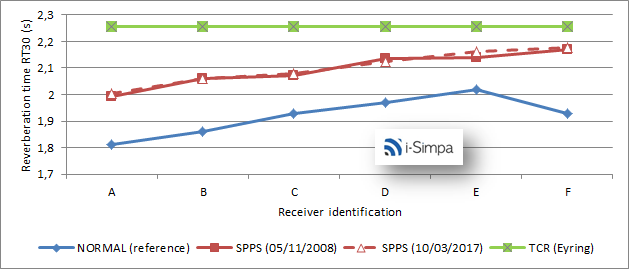
The SPPS code and the reference data show a similar behavior for the reverberation time (RT30), i.e. an increase of the RT30 with the distance from source (excepted for the last location, closed to the end wall of the corridor). However, the SPPS code slightly overestimate the RT30 (around 10%) in comparison with the NORMAL code.
Early decay time (EDT)
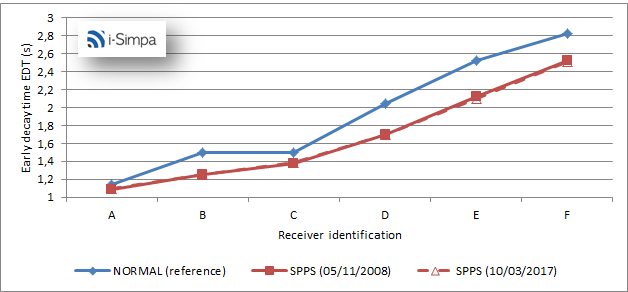
Here again, the SPPS code and the reference data show a similar behavior for the early decay time (EDT), i.e. an increase of the RT30 with the distance from source, but, unlike the previous comparison for the RT30, the EDT values are this time underestimated (around 4%-17%).
Calculation parameters
Reference
| Parameters | Value |
|---|---|
| Active calculation of Atmospheric absorption | NO |
| Active calculation of diffusion by fitting objects | NO |
| Active calculation of direct field only | NO |
| Active calculation of transmission | NO |
| Calculation method | Energetic |
| Limit value of the particle extinction | 5.0 |
| Number of sound particles per source | 5 000 000 |
| Number of sound particles per source (display) | |
| Random initialization number | |
| Receiver radius | 0.31 |
| Simulation length (s) | 2.000 |
| Time step (s) | 0.002 |
Reference
| Parameters | Value |
|---|---|
| Active calculation of Atmospheric absorption | NO |